
By Asabeneh Yetayeh
Pandas is an open source, high-performance, easy-to-use data structures and data analysis Python library. Pandas adds data structures and tools designed to work with table-like data which is Series and Data Frames. Pandas provides tools for data manipulation:
If you are using anaconda, you do not have to install pandas.
If you are in favor of videos, you can watch the video tutorial from here..
For Mac:
pip install conda
conda install pandas
For Windows:
pip install conda
pip install pandas
Pandas data structure is based on Series and DataFrames.
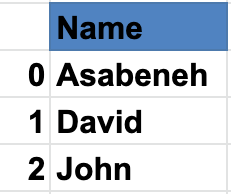
A series is a column and a DataFrame is a multidimensional table made up of collection of series. In order to create a pandas series we should use numpy to create a one dimensional arrays or a python list. Let us see an example of a series:
Names Pandas Series
Names Pandas Series
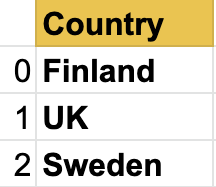
Countries Series
Cities Series
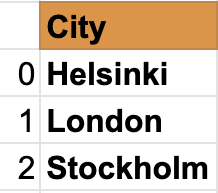
As you can see, pandas series is just one column of data. If we want to have multiple columns we use data frames. The example below shows pandas DataFrames.
Let us see, an example of a pandas data frame:
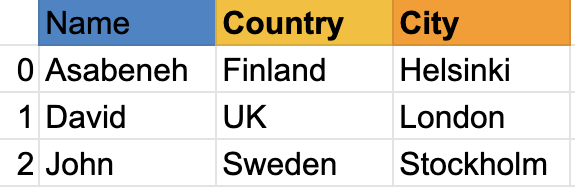
Data frame is a collection of rows and columns. Look at the table below; it has many more columns than the example above:
Next, we will see how to import pandas and how to create Series and DataFrames using pandas
import pandas as pd # importing pandas as pd
import numpy  as np # importing numpy as np
import pandas as pd # importing pandas as pd
import numpy  as np # importing numpy as np
### Pandas Version
pd.__version__
'1.1.3'
nums = [1, 2, 3, 4,5]
s = pd.Series(nums)
print(s)
0    1
1    2
2    3
3    4
4    5
dtype: int64
s.index
RangeIndex(start=0, stop=5, step=1)
list(s.index)
[0, 1, 2, 3, 4]
nums = [1, 2, 3, 4, 5]
s = pd.Series(nums, index=[1, 2, 3, 4, 5])
print(s)
1    1
2    2
3    3
4    4
5    5
dtype: int64
s.index
Int64Index([1, 2, 3, 4, 5], dtype='int64')
nums = [1, 2, 3, 4, 5]
s = pd.Series(nums, index=['A', 'B', 'C', 'D', 'E'])
print(s)
A    1
B    2
C    3
D    4
E    5
dtype: int64
s.index
Index(['A', 'B', 'C', 'D', 'E'], dtype='object')
fruits = ['Orange','Banana','Mango']
fruits = pd.Series(fruits, index=[1, 2, 3])
print(fruits)
1    Orange
2    Banana
3     Mango
dtype: object
fruits = ['Orange','Banana','Mango']
fruits = pd.Series(fruits, index=['O', 'B', 'M'])
print(fruits)
O    Orange
B    Banana
M     Mango
dtype: object
dct = {'name':'Asabeneh','country':'Finland','city':'Helsinki'}
s = pd.Series(dct)
print(s)
name       Asabeneh
country     Finland
city       Helsinki
dtype: object
dct = {'name':'Asabeneh','country':'Finland','city':'Helsinki'}
s = pd.Series(dct)
print(s)
name       Asabeneh
country     Finland
city       Helsinki
dtype: object
s = pd.Series(10, index = [1, 2, 3])
print(s)
1    10
2    10
3    10
dtype: int64
s = pd.Series(np.linspace(5, 20, 10)) # linspace(starting, end, items)
print(s)
0     5.000000
1     6.666667
2     8.333333
3    10.000000
4    11.666667
5    13.333333
6    15.000000
7    16.666667
8    18.333333
9    20.000000
dtype: float64
We can use the label to access Pandas series values. We can give labels to each item using the index argument
nums = [1, 2, 3]
s = pd.Series(nums, index =['A','B','C'])
print(s)
A    1
B    2
C    3
dtype: int64
s['A']
1
s['C']
3
# if we don't pass value to the index argument, the index of the pandas eries will start from zero
nums = [1, 2, 3]
s = pd.Series(nums)
print(s)
0    1
1    2
2    3
dtype: int64
s[0]
1
s[2]
3
Working on the copy does not affect the original data
copied_fruits = fruits.copy()
copied_fruits
O    Orange
B    Banana
M     Mango
dtype: object
Pandas data frame has both rows and columns that has two dimenstional data structure like 2-dimensional numpy array or table. It can be created in different ways.
data = [
    ['Asabeneh', 'Finland', 'Helsink'],
    ['David', 'UK', 'London'],
    ['John', 'Sweden', 'Stockholm']
]
df = pd.DataFrame(data, columns=['Names','Country','City'])
df
| Names | Country | City | |
|---|---|---|---|
| 0 | Asabeneh | Finland | Helsink |
| 1 | David | UK | London |
| 2 | John | Sweden | Stockholm |
data = {'Name': ['Asabeneh', 'David', 'John'], 'Country':[
    'Finland', 'UK', 'Sweden'], 'City': ['Helsiki', 'London', 'Stockholm']}
df = pd.DataFrame(data)
df
| Name | Country | City | |
|---|---|---|---|
| 0 | Asabeneh | Finland | Helsiki |
| 1 | David | UK | London |
| 2 | John | Sweden | Stockholm |
data = [
    {'Name': 'Asabeneh', 'Country': 'Finland', 'City': 'Helsinki'},
    {'Name': 'David', 'Country': 'UK', 'City': 'London'},
    {'Name': 'John', 'Country': 'Sweden', 'City': 'Stockholm'}]
df = pd.DataFrame(data)
df
| Name | Country | City | |
|---|---|---|---|
| 0 | Asabeneh | Finland | Helsinki |
| 1 | David | UK | London |
| 2 | John | Sweden | Stockholm |
We can read txt, json, csv, tsv, xls file formats using pandas reading methods
import pandas as pd

df = pd.read_csv('./datasets/weight-height.csv')
df
| Gender | Height | Weight | |
|---|---|---|---|
| 0 | Male | 73.847017 | 241.893563 |
| 1 | Male | 68.781904 | 162.310473 |
| 2 | Male | 74.110105 | 212.740856 |
| 3 | Male | 71.730978 | 220.042470 |
| 4 | Male | 69.881796 | 206.349801 |
| ... | ... | ... | ... |
| 9995 | Female | 66.172652 | 136.777454 |
| 9996 | Female | 67.067155 | 170.867906 |
| 9997 | Female | 63.867992 | 128.475319 |
| 9998 | Female | 69.034243 | 163.852461 |
| 9999 | Female | 61.944246 | 113.649103 |
10000 rows × 3 columns
Data exploration is an initial stage of data analysis used to explore and visualize data to get insights from the beginning of data analysis or identifing some patterns for further analysis.
The head() method gives 5 records by default, however, an agrument can be passed to the head() method.
df.head()
| Gender | Height | Weight | |
|---|---|---|---|
| 0 | Male | 73.847017 | 241.893563 |
| 1 | Male | 68.781904 | 162.310473 |
| 2 | Male | 74.110105 | 212.740856 |
| 3 | Male | 71.730978 | 220.042470 |
| 4 | Male | 69.881796 | 206.349801 |
The head() method with argument provides as large as the size of the argument. If we pass 10 in the head() as argument will get 10 records.
df.head(10)
| Gender | Height | Weight | |
|---|---|---|---|
| 0 | Male | 73.847017 | 241.893563 |
| 1 | Male | 68.781904 | 162.310473 |
| 2 | Male | 74.110105 | 212.740856 |
| 3 | Male | 71.730978 | 220.042470 |
| 4 | Male | 69.881796 | 206.349801 |
| 5 | Male | 67.253016 | 152.212156 |
| 6 | Male | 68.785081 | 183.927889 |
| 7 | Male | 68.348516 | 167.971110 |
| 8 | Male | 67.018950 | 175.929440 |
| 9 | Male | 63.456494 | 156.399676 |
To explore the last five records of the data set we use the tail() method. However, we can get fewer or larger records by changing the argument we pass to the tail() method.
df.tail()
| Gender | Height | Weight | |
|---|---|---|---|
| 9995 | Female | 66.172652 | 136.777454 |
| 9996 | Female | 67.067155 | 170.867906 |
| 9997 | Female | 63.867992 | 128.475319 |
| 9998 | Female | 69.034243 | 163.852461 |
| 9999 | Female | 61.944246 | 113.649103 |
df.tail(10) # tail() method with an argument
| Gender | Height | Weight | |
|---|---|---|---|
| 9990 | Female | 63.179498 | 141.266100 |
| 9991 | Female | 62.636675 | 102.853563 |
| 9992 | Female | 62.077832 | 138.691680 |
| 9993 | Female | 60.030434 | 97.687432 |
| 9994 | Female | 59.098250 | 110.529686 |
| 9995 | Female | 66.172652 | 136.777454 |
| 9996 | Female | 67.067155 | 170.867906 |
| 9997 | Female | 63.867992 | 128.475319 |
| 9998 | Female | 69.034243 | 163.852461 |
| 9999 | Female | 61.944246 | 113.649103 |
Knowing the fields or attributes of the dataset is one part of data exploration. In this dataset there are only three columns but most of the time, the size of columns is larger than this. Therefore, it is good to know how to get the columns and the size of the columns. We will use the .columns DataFrame attribute to get a column list.
df.columns
Index(['Gender', 'Height', 'Weight'], dtype='object')
The DataFrame shape allows to understand the dataset better. It tells the number of rows and columns
df.shape
(10000, 3)
Descriptive statistics summarizes a given data set that can be either a representation of the entire or a sample of a population. Descriptive statistics are divided into measures of central tendency and measures of variability (spread).
Measures of central tendency includes:
Measures of variability include:
Pandas describe() provides a descriptive statistics of a dataset. The method takes a couple of arguments
DataFrame.describe(percentiles=None, include=None, exclude=None, datetime_is_numeric=False)
df.describe() # without any argument
| Height | Weight | |
|---|---|---|
| count | 10000.000000 | 10000.000000 |
| mean | 66.367560 | 161.440357 |
| std | 3.847528 | 32.108439 |
| min | 54.263133 | 64.700127 |
| 25% | 63.505620 | 135.818051 |
| 50% | 66.318070 | 161.212928 |
| 75% | 69.174262 | 187.169525 |
| max | 78.998742 | 269.989699 |
df.describe(include='all', percentiles=[0.25, 0.5, 0.75, 0.85])
| Gender | Height | Weight | |
|---|---|---|---|
| count | 10000 | 10000.000000 | 10000.000000 |
| unique | 2 | NaN | NaN |
| top | Female | NaN | NaN |
| freq | 5000 | NaN | NaN |
| mean | NaN | 66.367560 | 161.440357 |
| std | NaN | 3.847528 | 32.108439 |
| min | NaN | 54.263133 | 64.700127 |
| 25% | NaN | 63.505620 | 135.818051 |
| 50% | NaN | 66.318070 | 161.212928 |
| 75% | NaN | 69.174262 | 187.169525 |
| 85% | NaN | 70.577106 | 197.536443 |
| max | NaN | 78.998742 | 269.989699 |
It also possible to get some information about the dataset using the method info(). The info() takes a couple of arguments.
DataFrame.info(verbose=None, buf=None, max_cols=None, memory_usage=None, show_counts=None, null_counts=None
df.info()
<class 'pandas.core.frame.DataFrame'>
RangeIndex: 10000 entries, 0 to 9999
Data columns (total 3 columns):
 #   Column  Non-Null Count  Dtype
---  ------  --------------  -----
 0   Gender  10000 non-null  object
 1   Height  10000 non-null  float64
 2   Weight  10000 non-null  float64
dtypes: float64(2), object(1)
memory usage: 234.5+ KB
df.info(verbose=True)
<class 'pandas.core.frame.DataFrame'>
RangeIndex: 10000 entries, 0 to 9999
Data columns (total 3 columns):
 #   Column  Non-Null Count  Dtype
---  ------  --------------  -----
 0   Gender  10000 non-null  object
 1   Height  10000 non-null  float64
 2   Weight  10000 non-null  float64
dtypes: float64(2), object(1)
memory usage: 234.5+ KB
Modifying a DataFrame:
- We can create a new DataFrame
- We can create a new column and add it to the DataFrame,
- we can remove an existing column from a DataFrame,
- we can modify an existing column in a DataFrame,
- we can change the data type of column values in the DataFrameAs we have seen before, it is possible to create DataFrame from list of lists, list of dictionaries or dictionaries.
As always, first we import the necessary packages. Now, lets import pandas and numpy, two best friends ever.
import pandas as pd
import numpy as np
data = [
    {"Name": "Asabeneh", "Country":"Finland","City":"Helsinki"},
    {"Name": "David", "Country":"UK","City":"London"},
    {"Name": "John", "Country":"Sweden","City":"Stockholm"},
    {"Name": "Eyob", "Country":"Finland","City":"Espoo"},
    {"Name": "Pawel", "Country":"Poland","City":"Warsaw"},
    {"Name": "Mahlet", "Country":"Ethiopia","City":"Addis Ababa"},
    {"Name": "Thomas", "Country":"Ethiopia","City":"Bahir Dar"},
    {"Name": "Lidiya", "Country":float('NaN'),"City":float('NaN')},
]
df = pd.DataFrame(data)
df
| Name | Country | City | |
|---|---|---|---|
| 0 | Asabeneh | Finland | Helsinki |
| 1 | David | UK | London |
| 2 | John | Sweden | Stockholm |
| 3 | Eyob | Finland | Espoo |
| 4 | Pawel | Poland | Warsaw |
| 5 | Mahlet | Ethiopia | Addis Ababa |
| 6 | Thomas | Ethiopia | Bahir Dar |
| 7 | Lidiya | NaN | NaN |
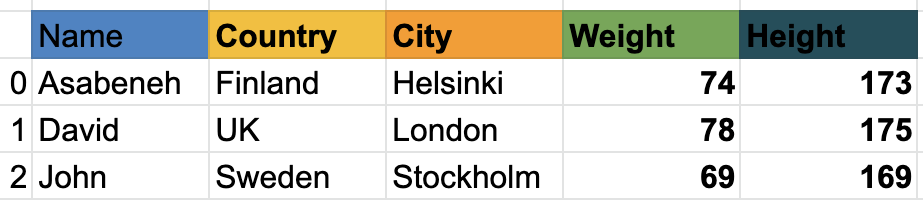
Let's add a weight column in the DataFrame
weights = [74, 78, 68, 108, 102, 58, 52, float('NaN')]
df['Weight'] = weights
df
| Name | Country | City | Weight | |
|---|---|---|---|---|
| 0 | Asabeneh | Finland | Helsinki | 74.0 |
| 1 | David | UK | London | 78.0 |
| 2 | John | Sweden | Stockholm | 68.0 |
| 3 | Eyob | Finland | Espoo | 108.0 |
| 4 | Pawel | Poland | Warsaw | 102.0 |
| 5 | Mahlet | Ethiopia | Addis Ababa | 58.0 |
| 6 | Thomas | Ethiopia | Bahir Dar | 52.0 |
| 7 | Lidiya | NaN | NaN | NaN |
Let's add a height column into the DataFrame as well
heights = [173, 175, 169, 173, 195,168, 170, float('NaN')]
df['Height'] = heights
df
| Name | Country | City | Weight | Height | |
|---|---|---|---|---|---|
| 0 | Asabeneh | Finland | Helsinki | 74.0 | 173.0 |
| 1 | David | UK | London | 78.0 | 175.0 |
| 2 | John | Sweden | Stockholm | 68.0 | 169.0 |
| 3 | Eyob | Finland | Espoo | 108.0 | 173.0 |
| 4 | Pawel | Poland | Warsaw | 102.0 | 195.0 |
| 5 | Mahlet | Ethiopia | Addis Ababa | 58.0 | 168.0 |
| 6 | Thomas | Ethiopia | Bahir Dar | 52.0 | 170.0 |
| 7 | Lidiya | NaN | NaN | NaN | NaN |
As you can see in the DataFrame above, we did add new columns, Weight and Height. Let's add one additional column called BMI(Body Mass Index) by calculating their BMI using thier mass and height. BMI is mass divided by height squared (in meters) - Weight/Height * Height.
As you can see, the height is in centimeters, so we shoud change it to meters. Let's modify the height row.
df['Height'] = df['Height'] * 0.01
df
| Name | Country | City | Weight | Height | |
|---|---|---|---|---|---|
| 0 | Asabeneh | Finland | Helsinki | 74.0 | 1.73 |
| 1 | David | UK | London | 78.0 | 1.75 |
| 2 | John | Sweden | Stockholm | 68.0 | 1.69 |
| 3 | Eyob | Finland | Espoo | 108.0 | 1.73 |
| 4 | Pawel | Poland | Warsaw | 102.0 | 1.95 |
| 5 | Mahlet | Ethiopia | Addis Ababa | 58.0 | 1.68 |
| 6 | Thomas | Ethiopia | Bahir Dar | 52.0 | 1.70 |
| 7 | Lidiya | NaN | NaN | NaN | NaN |
# Using functions makes our code clean, but you can calculate the bmi without a function
def calculate_bmi ():
    weights = df['Weight']
    heights = df['Height']
    bmi = []
    for w,h in zip(weights, heights):
        b = w/(h*h)
        bmi.append(b)
    return bmi

bmi = calculate_bmi()
df['BMI'] = bmi
df
| Name | Country | City | Weight | Height | BMI | |
|---|---|---|---|---|---|---|
| 0 | Asabeneh | Finland | Helsinki | 74.0 | 1.73 | 24.725183 |
| 1 | David | UK | London | 78.0 | 1.75 | 25.469388 |
| 2 | John | Sweden | Stockholm | 68.0 | 1.69 | 23.808690 |
| 3 | Eyob | Finland | Espoo | 108.0 | 1.73 | 36.085402 |
| 4 | Pawel | Poland | Warsaw | 102.0 | 1.95 | 26.824458 |
| 5 | Mahlet | Ethiopia | Addis Ababa | 58.0 | 1.68 | 20.549887 |
| 6 | Thomas | Ethiopia | Bahir Dar | 52.0 | 1.70 | 17.993080 |
| 7 | Lidiya | NaN | NaN | NaN | NaN | NaN |
The BMI column values of the DataFrame are float with many significant digits after decimal. Let's change it to one significant digit after point.
df['BMI'] = round(df['BMI'], 1)
df
| Name | Country | City | Weight | Height | BMI | |
|---|---|---|---|---|---|---|
| 0 | Asabeneh | Finland | Helsinki | 74.0 | 1.73 | 24.7 |
| 1 | David | UK | London | 78.0 | 1.75 | 25.5 |
| 2 | John | Sweden | Stockholm | 68.0 | 1.69 | 23.8 |
| 3 | Eyob | Finland | Espoo | 108.0 | 1.73 | 36.1 |
| 4 | Pawel | Poland | Warsaw | 102.0 | 1.95 | 26.8 |
| 5 | Mahlet | Ethiopia | Addis Ababa | 58.0 | 1.68 | 20.5 |
| 6 | Thomas | Ethiopia | Bahir Dar | 52.0 | 1.70 | 18.0 |
| 7 | Lidiya | NaN | NaN | NaN | NaN | NaN |
df.head(25)
| Name | Country | City | Weight | Height | BMI | |
|---|---|---|---|---|---|---|
| 0 | Asabeneh | Finland | Helsinki | 74.0 | 1.73 | 24.7 |
| 1 | David | UK | London | 78.0 | 1.75 | 25.5 |
| 2 | John | Sweden | Stockholm | 68.0 | 1.69 | 23.8 |
| 3 | Eyob | Finland | Espoo | 108.0 | 1.73 | 36.1 |
| 4 | Pawel | Poland | Warsaw | 102.0 | 1.95 | 26.8 |
| 5 | Mahlet | Ethiopia | Addis Ababa | 58.0 | 1.68 | 20.5 |
| 6 | Thomas | Ethiopia | Bahir Dar | 52.0 | 1.70 | 18.0 |
| 7 | Lidiya | NaN | NaN | NaN | NaN | NaN |
The information in the DataFrame seems not yet complete, let's add birth year and current year columns.
birth_year = ['1769', '1985', '1990', '1983', '1985','1995', '1999',float('NaN')]
df['Birth Year'] = birth_year
df['Current Year'] = 2021
df
| Name | Country | City | Weight | Height | BMI | Birth Year | Current Year | |
|---|---|---|---|---|---|---|---|---|
| 0 | Asabeneh | Finland | Helsinki | 74.0 | 1.73 | 24.7 | 1769 | 2021 |
| 1 | David | UK | London | 78.0 | 1.75 | 25.5 | 1985 | 2021 |
| 2 | John | Sweden | Stockholm | 68.0 | 1.69 | 23.8 | 1990 | 2021 |
| 3 | Eyob | Finland | Espoo | 108.0 | 1.73 | 36.1 | 1983 | 2021 |
| 4 | Pawel | Poland | Warsaw | 102.0 | 1.95 | 26.8 | 1985 | 2021 |
| 5 | Mahlet | Ethiopia | Addis Ababa | 58.0 | 1.68 | 20.5 | 1995 | 2021 |
| 6 | Thomas | Ethiopia | Bahir Dar | 52.0 | 1.70 | 18.0 | 1999 | 2021 |
| 7 | Lidiya | NaN | NaN | NaN | NaN | NaN | NaN | 2021 |
Sometimes, we may be interested to work on the copy of the original file and we want to keep the original file intact.
df_copy = df.copy()
df_copy
| Name | Country | City | Weight | Height | BMI | Birth Year | Current Year | |
|---|---|---|---|---|---|---|---|---|
| 0 | Asabeneh | Finland | Helsinki | 74.0 | 1.73 | 24.7 | 1769 | 2021 |
| 1 | David | UK | London | 78.0 | 1.75 | 25.5 | 1985 | 2021 |
| 2 | John | Sweden | Stockholm | 68.0 | 1.69 | 23.8 | 1990 | 2021 |
| 3 | Eyob | Finland | Espoo | 108.0 | 1.73 | 36.1 | 1983 | 2021 |
| 4 | Pawel | Poland | Warsaw | 102.0 | 1.95 | 26.8 | 1985 | 2021 |
| 5 | Mahlet | Ethiopia | Addis Ababa | 58.0 | 1.68 | 20.5 | 1995 | 2021 |
| 6 | Thomas | Ethiopia | Bahir Dar | 52.0 | 1.70 | 18.0 | 1999 | 2021 |
| 7 | Lidiya | NaN | NaN | NaN | NaN | NaN | NaN | 2021 |
# Let us imagine the Name column is not important.
# This does not affect the original data frame. To change from the original data frame we should add the inpplace argument
df.drop('Name', axis=1)
| Country | City | Weight | Height | BMI | Birth Year | Current Year | |
|---|---|---|---|---|---|---|---|
| 0 | Finland | Helsinki | 74.0 | 1.73 | 24.7 | 1769 | 2021 |
| 1 | UK | London | 78.0 | 1.75 | 25.5 | 1985 | 2021 |
| 2 | Sweden | Stockholm | 68.0 | 1.69 | 23.8 | 1990 | 2021 |
| 3 | Finland | Espoo | 108.0 | 1.73 | 36.1 | 1983 | 2021 |
| 4 | Poland | Warsaw | 102.0 | 1.95 | 26.8 | 1985 | 2021 |
| 5 | Ethiopia | Addis Ababa | 58.0 | 1.68 | 20.5 | 1995 | 2021 |
| 6 | Ethiopia | Bahir Dar | 52.0 | 1.70 | 18.0 | 1999 | 2021 |
| 7 | NaN | NaN | NaN | NaN | NaN | NaN | 2021 |
#The original dataframe has not beeen changes
df
| Name | Country | City | Weight | Height | BMI | Birth Year | Current Year | |
|---|---|---|---|---|---|---|---|---|
| 0 | Asabeneh | Finland | Helsinki | 74.0 | 1.73 | 24.7 | 1769 | 2021 |
| 1 | David | UK | London | 78.0 | 1.75 | 25.5 | 1985 | 2021 |
| 2 | John | Sweden | Stockholm | 68.0 | 1.69 | 23.8 | 1990 | 2021 |
| 3 | Eyob | Finland | Espoo | 108.0 | 1.73 | 36.1 | 1983 | 2021 |
| 4 | Pawel | Poland | Warsaw | 102.0 | 1.95 | 26.8 | 1985 | 2021 |
| 5 | Mahlet | Ethiopia | Addis Ababa | 58.0 | 1.68 | 20.5 | 1995 | 2021 |
| 6 | Thomas | Ethiopia | Bahir Dar | 52.0 | 1.70 | 18.0 | 1999 | 2021 |
| 7 | Lidiya | NaN | NaN | NaN | NaN | NaN | NaN | 2021 |
# Let us imagine the Name column is not important.
# This does not affect the original data frame. To change from the original data frame we should add the inpplace argument
df.drop('Name', axis=1, inplace=True)
df
| Country | City | Weight | Height | BMI | Birth Year | Current Year | |
|---|---|---|---|---|---|---|---|
| 0 | Finland | Helsinki | 74.0 | 1.73 | 24.7 | 1769 | 2021 |
| 1 | UK | London | 78.0 | 1.75 | 25.5 | 1985 | 2021 |
| 2 | Sweden | Stockholm | 68.0 | 1.69 | 23.8 | 1990 | 2021 |
| 3 | Finland | Espoo | 108.0 | 1.73 | 36.1 | 1983 | 2021 |
| 4 | Poland | Warsaw | 102.0 | 1.95 | 26.8 | 1985 | 2021 |
| 5 | Ethiopia | Addis Ababa | 58.0 | 1.68 | 20.5 | 1995 | 2021 |
| 6 | Ethiopia | Bahir Dar | 52.0 | 1.70 | 18.0 | 1999 | 2021 |
| 7 | NaN | NaN | NaN | NaN | NaN | NaN | 2021 |
# We can also use the columns attribute to delete a column. Let us remove the country column
# To change the original we should make the inplace argument True
df.drop(columns = 'Country', axis=1)
| City | Weight | Height | BMI | Birth Year | Current Year | |
|---|---|---|---|---|---|---|
| 0 | Helsinki | 74.0 | 1.73 | 24.7 | 1769 | 2021 |
| 1 | London | 78.0 | 1.75 | 25.5 | 1985 | 2021 |
| 2 | Stockholm | 68.0 | 1.69 | 23.8 | 1990 | 2021 |
| 3 | Espoo | 108.0 | 1.73 | 36.1 | 1983 | 2021 |
| 4 | Warsaw | 102.0 | 1.95 | 26.8 | 1985 | 2021 |
| 5 | Addis Ababa | 58.0 | 1.68 | 20.5 | 1995 | 2021 |
| 6 | Bahir Dar | 52.0 | 1.70 | 18.0 | 1999 | 2021 |
| 7 | NaN | NaN | NaN | NaN | NaN | 2021 |
#### Removing multiple columns
df.drop(['Country','City'], axis=1)
| Weight | Height | BMI | Birth Year | Current Year | |
|---|---|---|---|---|---|
| 0 | 74.0 | 1.73 | 24.7 | 1769 | 2021 |
| 1 | 78.0 | 1.75 | 25.5 | 1985 | 2021 |
| 2 | 68.0 | 1.69 | 23.8 | 1990 | 2021 |
| 3 | 108.0 | 1.73 | 36.1 | 1983 | 2021 |
| 4 | 102.0 | 1.95 | 26.8 | 1985 | 2021 |
| 5 | 58.0 | 1.68 | 20.5 | 1995 | 2021 |
| 6 | 52.0 | 1.70 | 18.0 | 1999 | 2021 |
| 7 | NaN | NaN | NaN | NaN | 2021 |
The seventh row does not have full information and it is not important to keep in the dataset. Let's remove the sventh row.
# To delete it from the original dataframe the inplace=True should be included
df.drop([7,5], axis = 0)
| Country | City | Weight | Height | BMI | Birth Year | Current Year | |
|---|---|---|---|---|---|---|---|
| 0 | Finland | Helsinki | 74.0 | 1.73 | 24.7 | 1769 | 2021 |
| 1 | UK | London | 78.0 | 1.75 | 25.5 | 1985 | 2021 |
| 2 | Sweden | Stockholm | 68.0 | 1.69 | 23.8 | 1990 | 2021 |
| 3 | Finland | Espoo | 108.0 | 1.73 | 36.1 | 1983 | 2021 |
| 4 | Poland | Warsaw | 102.0 | 1.95 | 26.8 | 1985 | 2021 |
| 6 | Ethiopia | Bahir Dar | 52.0 | 1.70 | 18.0 | 1999 | 2021 |
df
| Country | City | Weight | Height | BMI | Birth Year | Current Year | |
|---|---|---|---|---|---|---|---|
| 0 | Finland | Helsinki | 74.0 | 1.73 | 24.7 | 1769 | 2021 |
| 1 | UK | London | 78.0 | 1.75 | 25.5 | 1985 | 2021 |
| 2 | Sweden | Stockholm | 68.0 | 1.69 | 23.8 | 1990 | 2021 |
| 3 | Finland | Espoo | 108.0 | 1.73 | 36.1 | 1983 | 2021 |
| 4 | Poland | Warsaw | 102.0 | 1.95 | 26.8 | 1985 | 2021 |
| 5 | Ethiopia | Addis Ababa | 58.0 | 1.68 | 20.5 | 1995 | 2021 |
| 6 | Ethiopia | Bahir Dar | 52.0 | 1.70 | 18.0 | 1999 | 2021 |
| 7 | NaN | NaN | NaN | NaN | NaN | NaN | 2021 |
# To modifiy original dataframe the inplace=True should be included
df.rename(
    columns={
        "Country": "country",
        "City": "city",
        "Weight":"weight",
        "Height":"height",
        "BMI":'bmi',
        'Birth Year':'birth_year',
        'Current Year':'current_year'
    }
)
| country | city | weight | height | bmi | birth_year | current_year | |
|---|---|---|---|---|---|---|---|
| 0 | Finland | Helsinki | 74.0 | 1.73 | 24.7 | 1769 | 2021 |
| 1 | UK | London | 78.0 | 1.75 | 25.5 | 1985 | 2021 |
| 2 | Sweden | Stockholm | 68.0 | 1.69 | 23.8 | 1990 | 2021 |
| 3 | Finland | Espoo | 108.0 | 1.73 | 36.1 | 1983 | 2021 |
| 4 | Poland | Warsaw | 102.0 | 1.95 | 26.8 | 1985 | 2021 |
| 5 | Ethiopia | Addis Ababa | 58.0 | 1.68 | 20.5 | 1995 | 2021 |
| 6 | Ethiopia | Bahir Dar | 52.0 | 1.70 | 18.0 | 1999 | 2021 |
| 7 | NaN | NaN | NaN | NaN | NaN | NaN | 2021 |
df.rename(columns = str.lower)
| country | city | weight | height | bmi | birth year | current year | |
|---|---|---|---|---|---|---|---|
| 0 | Finland | Helsinki | 74.0 | 1.73 | 24.7 | 1769 | 2021 |
| 1 | UK | London | 78.0 | 1.75 | 25.5 | 1985 | 2021 |
| 2 | Sweden | Stockholm | 68.0 | 1.69 | 23.8 | 1990 | 2021 |
| 3 | Finland | Espoo | 108.0 | 1.73 | 36.1 | 1983 | 2021 |
| 4 | Poland | Warsaw | 102.0 | 1.95 | 26.8 | 1985 | 2021 |
| 5 | Ethiopia | Addis Ababa | 58.0 | 1.68 | 20.5 | 1995 | 2021 |
| 6 | Ethiopia | Bahir Dar | 52.0 | 1.70 | 18.0 | 1999 | 2021 |
| 7 | NaN | NaN | NaN | NaN | NaN | NaN | 2021 |
df
| Country | City | Weight | Height | BMI | Birth Year | Current Year | |
|---|---|---|---|---|---|---|---|
| 0 | Finland | Helsinki | 74.0 | 1.73 | 24.7 | 1769 | 2021 |
| 1 | UK | London | 78.0 | 1.75 | 25.5 | 1985 | 2021 |
| 2 | Sweden | Stockholm | 68.0 | 1.69 | 23.8 | 1990 | 2021 |
| 3 | Finland | Espoo | 108.0 | 1.73 | 36.1 | 1983 | 2021 |
| 4 | Poland | Warsaw | 102.0 | 1.95 | 26.8 | 1985 | 2021 |
| 5 | Ethiopia | Addis Ababa | 58.0 | 1.68 | 20.5 | 1995 | 2021 |
| 6 | Ethiopia | Bahir Dar | 52.0 | 1.70 | 18.0 | 1999 | 2021 |
| 7 | NaN | NaN | NaN | NaN | NaN | NaN | 2021 |
df.Weight.dtype
dtype('float64')
df['Birth Year'].dtype # it gives string object , we should change this to
dtype('O')
df.drop([7, 5], axis = 0, inplace=True)
df['Birth Year'] = df['Birth Year'].astype('int')

print(df['Birth Year'].dtype)
int32
df['Birth Year']
0    1769
1    1985
2    1990
3    1983
4    1985
6    1999
Name: Birth Year, dtype: int32
Now same for the current year:
df['Current Year'] = df['Current Year'].astype('int')
df['Current Year'].dtype
dtype('int32')
Now, the column values of birth year and current year are integers. We can calculate the age.
ages = df['Current Year'] - df['Birth Year']
ages
0    252
1     36
2     31
3     38
4     36
6     22
dtype: int32
df['Birth Year']
0    1769
1    1985
2    1990
3    1983
4    1985
6    1999
Name: Birth Year, dtype: int32
df
| Country | City | Weight | Height | BMI | Birth Year | Current Year | |
|---|---|---|---|---|---|---|---|
| 0 | Finland | Helsinki | 74.0 | 1.73 | 24.7 | 1769 | 2021 |
| 1 | UK | London | 78.0 | 1.75 | 25.5 | 1985 | 2021 |
| 2 | Sweden | Stockholm | 68.0 | 1.69 | 23.8 | 1990 | 2021 |
| 3 | Finland | Espoo | 108.0 | 1.73 | 36.1 | 1983 | 2021 |
| 4 | Poland | Warsaw | 102.0 | 1.95 | 26.8 | 1985 | 2021 |
| 6 | Ethiopia | Bahir Dar | 52.0 | 1.70 | 18.0 | 1999 | 2021 |
df['Ages'] = ages
df
| Country | City | Weight | Height | BMI | Birth Year | Current Year | Ages | |
|---|---|---|---|---|---|---|---|---|
| 0 | Finland | Helsinki | 74.0 | 1.73 | 24.7 | 1769 | 2021 | 252 |
| 1 | UK | London | 78.0 | 1.75 | 25.5 | 1985 | 2021 | 36 |
| 2 | Sweden | Stockholm | 68.0 | 1.69 | 23.8 | 1990 | 2021 | 31 |
| 3 | Finland | Espoo | 108.0 | 1.73 | 36.1 | 1983 | 2021 | 38 |
| 4 | Poland | Warsaw | 102.0 | 1.95 | 26.8 | 1985 | 2021 | 36 |
| 6 | Ethiopia | Bahir Dar | 52.0 | 1.70 | 18.0 | 1999 | 2021 | 22 |
The person in the first row lived so far for 251 years. It is unlikely for someone to live so long. Either it is a typo or the data is cooked. So lets fill that data with average of the columns without including outlier.
mean = (35 + 30) / 2
mean = (35 + 30) / 2
print('Mean: ',mean) #it is good to add some description to the output, so we know what is what
Mean: 32.5
df
| Country | City | Weight | Height | BMI | Birth Year | Current Year | Ages | |
|---|---|---|---|---|---|---|---|---|
| 0 | Finland | Helsinki | 74.0 | 1.73 | 24.7 | 1769 | 2021 | 252 |
| 1 | UK | London | 78.0 | 1.75 | 25.5 | 1985 | 2021 | 36 |
| 2 | Sweden | Stockholm | 68.0 | 1.69 | 23.8 | 1990 | 2021 | 31 |
| 3 | Finland | Espoo | 108.0 | 1.73 | 36.1 | 1983 | 2021 | 38 |
| 4 | Poland | Warsaw | 102.0 | 1.95 | 26.8 | 1985 | 2021 | 36 |
| 6 | Ethiopia | Bahir Dar | 52.0 | 1.70 | 18.0 | 1999 | 2021 | 22 |
We can use the iloc method to impute the value. DataFrame.iloc(row, col)
df.iloc[0, 7] = (35 + 30) / 2
df
| Country | City | Weight | Height | BMI | Birth Year | Current Year | Ages | |
|---|---|---|---|---|---|---|---|---|
| 0 | Finland | Helsinki | 74.0 | 1.73 | 24.7 | 1769 | 2021 | 32.5 |
| 1 | UK | London | 78.0 | 1.75 | 25.5 | 1985 | 2021 | 36.0 |
| 2 | Sweden | Stockholm | 68.0 | 1.69 | 23.8 | 1990 | 2021 | 31.0 |
| 3 | Finland | Espoo | 108.0 | 1.73 | 36.1 | 1983 | 2021 | 38.0 |
| 4 | Poland | Warsaw | 102.0 | 1.95 | 26.8 | 1985 | 2021 | 36.0 |
| 6 | Ethiopia | Bahir Dar | 52.0 | 1.70 | 18.0 | 1999 | 2021 | 22.0 |
We can select a specified column(s) from a pandas dataframe
# Let's select the country column
df['Country']
0     Finland
1          UK
2      Sweden
3     Finland
4      Poland
6    Ethiopia
Name: Country, dtype: object
# let us select the city column
df['City']
0     Helsinki
1       London
2    Stockholm
3        Espoo
4       Warsaw
6    Bahir Dar
Name: City, dtype: object
# let us select Country and City columns
df[['Country','City']]
| Country | City | |
|---|---|---|
| 0 | Finland | Helsinki |
| 1 | UK | London |
| 2 | Sweden | Stockholm |
| 3 | Finland | Espoo |
| 4 | Poland | Warsaw |
| 6 | Ethiopia | Bahir Dar |
# let us select the height, weight, BMI, ages column
df[['Height','Weight','BMI','Ages']]
| Height | Weight | BMI | Ages | |
|---|---|---|---|---|
| 0 | 1.73 | 74.0 | 24.7 | 32.5 |
| 1 | 1.75 | 78.0 | 25.5 | 36.0 |
| 2 | 1.69 | 68.0 | 23.8 | 31.0 |
| 3 | 1.73 | 108.0 | 36.1 | 38.0 |
| 4 | 1.95 | 102.0 | 26.8 | 36.0 |
| 6 | 1.70 | 52.0 | 18.0 | 22.0 |
We can use boolean indexing to select some part of the rows. In the example below, we are selecting rows with birth year less than 1900.
# people that were born before 1990
df[df['Birth Year'] < 1900]
| Country | City | Weight | Height | BMI | Birth Year | Current Year | Ages | |
|---|---|---|---|---|---|---|---|---|
| 0 | Finland | Helsinki | 74.0 | 1.73 | 24.7 | 1769 | 2021 | 32.5 |
# BMI if BMI is 18.5 to 25, it is a healthy weight
df[df['BMI'] <= 25]
| Country | City | Weight | Height | BMI | Birth Year | Current Year | Ages | |
|---|---|---|---|---|---|---|---|---|
| 0 | Finland | Helsinki | 74.0 | 1.73 | 24.7 | 1769 | 2021 | 32.5 |
| 2 | Sweden | Stockholm | 68.0 | 1.69 | 23.8 | 1990 | 2021 | 31.0 |
| 6 | Ethiopia | Bahir Dar | 52.0 | 1.70 | 18.0 | 1999 | 2021 | 22.0 |
## Let's select peopel from Finland
df[df['Country'] =='Finland']
| Country | City | Weight | Height | BMI | Birth Year | Current Year | Ages | |
|---|---|---|---|---|---|---|---|---|
| 0 | Finland | Helsinki | 74.0 | 1.73 | 24.7 | 1769 | 2021 | 32.5 |
| 3 | Finland | Espoo | 108.0 | 1.73 | 36.1 | 1983 | 2021 | 38.0 |
## Let's select people taller than 1.75 meter
df[df['Height'] > 1.7]
| Country | City | Weight | Height | BMI | Birth Year | Current Year | Ages | |
|---|---|---|---|---|---|---|---|---|
| 0 | Finland | Helsinki | 74.0 | 1.73 | 24.7 | 1769 | 2021 | 32.5 |
| 1 | UK | London | 78.0 | 1.75 | 25.5 | 1985 | 2021 | 36.0 |
| 3 | Finland | Espoo | 108.0 | 1.73 | 36.1 | 1983 | 2021 | 38.0 |
| 4 | Poland | Warsaw | 102.0 | 1.95 | 26.8 | 1985 | 2021 | 36.0 |
def classify_bmi(bmi):
    if bmi >= 30:
        return 'Obesity Range'
    elif bmi < 30 and bmi > 25:
        return 'Overweight Range'
    elif bmi < 25 and bmi >= 18.5:
        return 'Healthy Range'
    elif bmi < 18.5:
        return 'Underweight Range'
df['BMI class'] = df['BMI'].apply(lambda x: classify_bmi(x))
df
| Country | City | Weight | Height | BMI | Birth Year | Current Year | Ages | BMI class | |
|---|---|---|---|---|---|---|---|---|---|
| 0 | Finland | Helsinki | 74.0 | 1.73 | 24.7 | 1769 | 2021 | 32.5 | Healthy Range |
| 1 | UK | London | 78.0 | 1.75 | 25.5 | 1985 | 2021 | 36.0 | Overweight Range |
| 2 | Sweden | Stockholm | 68.0 | 1.69 | 23.8 | 1990 | 2021 | 31.0 | Healthy Range |
| 3 | Finland | Espoo | 108.0 | 1.73 | 36.1 | 1983 | 2021 | 38.0 | Obesity Range |
| 4 | Poland | Warsaw | 102.0 | 1.95 | 26.8 | 1985 | 2021 | 36.0 | Overweight Range |
| 6 | Ethiopia | Bahir Dar | 52.0 | 1.70 | 18.0 | 1999 | 2021 | 22.0 | Underweight Range |
Pandas has loc attribute uses the pandas dataframe location or rows to return one or more row(s). If the dataframe does not have name indexes we can use positive number indexes that starts from zero. However, if the dataframe has a named indexes, we can use the name use the loc attribute to access the row(s).
# Accessing only the first row
df.loc[0]
Country               Finland
City                 Helsinki
Weight                     74
Height                   1.73
BMI                      24.7
Birth Year               1769
Current Year             2021
Ages                     32.5
BMI class       Healthy Range
Name: 0, dtype: object
# Second row
df.loc[1]
Country                       UK
City                      London
Weight                        78
Height                      1.75
BMI                         25.5
Birth Year                  1985
Current Year                2021
Ages                          36
BMI class       Overweight Range
Name: 1, dtype: object
# Accessing the fifth column
df.iloc[4]
Country                   Poland
City                      Warsaw
Weight                       102
Height                      1.95
BMI                         26.8
Birth Year                  1985
Current Year                2021
Ages                          36
BMI class       Overweight Range
Name: 4, dtype: object
To access multiple rows, we pass list indexes of the rows
# Accessing the first and second row
df.loc[[0,1]]
| Country | City | Weight | Height | BMI | Birth Year | Current Year | Ages | BMI class | |
|---|---|---|---|---|---|---|---|---|---|
| 0 | Finland | Helsinki | 74.0 | 1.73 | 24.7 | 1769 | 2021 | 32.5 | Healthy Range |
| 1 | UK | London | 78.0 | 1.75 | 25.5 | 1985 | 2021 | 36.0 | Overweight Range |
# Accessing the first, third and fifth
df.loc[[0, 2, 4]]
| Country | City | Weight | Height | BMI | Birth Year | Current Year | Ages | BMI class | |
|---|---|---|---|---|---|---|---|---|---|
| 0 | Finland | Helsinki | 74.0 | 1.73 | 24.7 | 1769 | 2021 | 32.5 | Healthy Range |
| 2 | Sweden | Stockholm | 68.0 | 1.69 | 23.8 | 1990 | 2021 | 31.0 | Healthy Range |
| 4 | Poland | Warsaw | 102.0 | 1.95 | 26.8 | 1985 | 2021 | 36.0 | Overweight Range |
data = [
    {"Name": "Asabeneh", "Country":"Finland","City":"Helsinki"},
    {"Name": "David", "Country":"UK","City":"London"},
    {"Name": "John", "Country":"Sweden","City":"Stockholm"},
    {"Name": "Eyob", "Country":"Finland","City":"Espoo"},
    {"Name": "Pawel", "Country":"Poland","City":"Warsaw"},
    {"Name": "Mahlet", "Country":"Ethiopia","City":"Addis Ababa"},
    {"Name": "Thomas", "Country":"Ethiopia","City":"Bahir Dar"},

]
df = pd.DataFrame(data, index = ['A','B','C','D','E','F','G'])
df
| Name | Country | City | |
|---|---|---|---|
| A | Asabeneh | Finland | Helsinki |
| B | David | UK | London |
| C | John | Sweden | Stockholm |
| D | Eyob | Finland | Espoo |
| E | Pawel | Poland | Warsaw |
| F | Mahlet | Ethiopia | Addis Ababa |
| G | Thomas | Ethiopia | Bahir Dar |
# Accessing a signle row that is named B
df.loc['A']
Name       Asabeneh
Country     Finland
City       Helsinki
Name: A, dtype: object
# Accessing a single row that is named B
df.loc['B']
Name        David
Country        UK
City       London
Name: B, dtype: object
df.loc[['A','B', 'E','G']]
| Name | Country | City | |
|---|---|---|---|
| A | Asabeneh | Finland | Helsinki |
| B | David | UK | London |
| E | Pawel | Poland | Warsaw |
| G | Thomas | Ethiopia | Bahir Dar |
df
| Name | Country | City | |
|---|---|---|---|
| A | Asabeneh | Finland | Helsinki |
| B | David | UK | London |
| C | John | Sweden | Stockholm |
| D | Eyob | Finland | Espoo |
| E | Pawel | Poland | Warsaw |
| F | Mahlet | Ethiopia | Addis Ababa |
| G | Thomas | Ethiopia | Bahir Dar |
# We can also access specific cell

df.loc['A', 'Name']
'Asabeneh'
df.loc['C','Name']
'John'
df.loc['C','City']
'Stockholm'
.iloc[] is primarily integer position based (from 0 to length-1 of the axis), but may also be used with a boolean array.
Allowed inputs are:
An integer, e.g. 5.
A list or array of integers, e.g. [4, 3, 0].
A slice object with ints, e.g. 1:7.
A boolean array.
A callable function with one argument (the calling Series or DataFrame) and that returns valid output for indexing (one of the above). This is useful in method chains, when you don’t have a reference to the calling object, but would like to base your selection on some value.
.iloc will raise IndexError if a requested indexer is out-of-bounds, except slice indexers which allow out-of-bounds indexing (this conforms with python/numpy slice semantics).
# re-assigning the copied file, the df variable easy easy to write
df = df_copy
df['BMI class'] = df['BMI'].apply(lambda x : classify_bmi(x))
# first row

df.iloc[0]
Name                 Asabeneh
Country               Finland
City                 Helsinki
Weight                     74
Height                   1.73
BMI                      24.7
Birth Year               1769
Current Year             2021
BMI class       Healthy Range
Name: 0, dtype: object
df.iloc[[0]]
| Name | Country | City | Weight | Height | BMI | Birth Year | Current Year | BMI class | |
|---|---|---|---|---|---|---|---|---|---|
| 0 | Asabeneh | Finland | Helsinki | 74.0 | 1.73 | 24.7 | 1769 | 2021 | Healthy Range |
# second row
df.iloc[1]
Name                       David
Country                       UK
City                      London
Weight                        78
Height                      1.75
BMI                         25.5
Birth Year                  1985
Current Year                2021
BMI class       Overweight Range
Name: 1, dtype: object
df.iloc[[1]]
| Name | Country | City | Weight | Height | BMI | Birth Year | Current Year | BMI class | |
|---|---|---|---|---|---|---|---|---|---|
| 1 | David | UK | London | 78.0 | 1.75 | 25.5 | 1985 | 2021 | Overweight Range |
# some selected rows
df.iloc[[0, 2, 4]]
| Name | Country | City | Weight | Height | BMI | Birth Year | Current Year | BMI class | |
|---|---|---|---|---|---|---|---|---|---|
| 0 | Asabeneh | Finland | Helsinki | 74.0 | 1.73 | 24.7 | 1769 | 2021 | Healthy Range |
| 2 | John | Sweden | Stockholm | 68.0 | 1.69 | 23.8 | 1990 | 2021 | Healthy Range |
| 4 | Pawel | Poland | Warsaw | 102.0 | 1.95 | 26.8 | 1985 | 2021 | Overweight Range |
# display all the data
df.iloc[:]
| Name | Country | City | Weight | Height | BMI | Birth Year | Current Year | BMI class | |
|---|---|---|---|---|---|---|---|---|---|
| 0 | Asabeneh | Finland | Helsinki | 74.0 | 1.73 | 24.7 | 1769 | 2021 | Healthy Range |
| 1 | David | UK | London | 78.0 | 1.75 | 25.5 | 1985 | 2021 | Overweight Range |
| 2 | John | Sweden | Stockholm | 68.0 | 1.69 | 23.8 | 1990 | 2021 | Healthy Range |
| 3 | Eyob | Finland | Espoo | 108.0 | 1.73 | 36.1 | 1983 | 2021 | Obesity Range |
| 4 | Pawel | Poland | Warsaw | 102.0 | 1.95 | 26.8 | 1985 | 2021 | Overweight Range |
| 5 | Mahlet | Ethiopia | Addis Ababa | 58.0 | 1.68 | 20.5 | 1995 | 2021 | Healthy Range |
| 6 | Thomas | Ethiopia | Bahir Dar | 52.0 | 1.70 | 18.0 | 1999 | 2021 | Underweight Range |
| 7 | Lidiya | NaN | NaN | NaN | NaN | NaN | NaN | 2021 | None |
# slicing the first second row
df.iloc[0:2]
| Name | Country | City | Weight | Height | BMI | Birth Year | Current Year | BMI class | |
|---|---|---|---|---|---|---|---|---|---|
| 0 | Asabeneh | Finland | Helsinki | 74.0 | 1.73 | 24.7 | 1769 | 2021 | Healthy Range |
| 1 | David | UK | London | 78.0 | 1.75 | 25.5 | 1985 | 2021 | Overweight Range |
df
| Name | Country | City | Weight | Height | BMI | Birth Year | Current Year | BMI class | |
|---|---|---|---|---|---|---|---|---|---|
| 0 | Asabeneh | Finland | Helsinki | 74.0 | 1.73 | 24.7 | 1769 | 2021 | Healthy Range |
| 1 | David | UK | London | 78.0 | 1.75 | 25.5 | 1985 | 2021 | Overweight Range |
| 2 | John | Sweden | Stockholm | 68.0 | 1.69 | 23.8 | 1990 | 2021 | Healthy Range |
| 3 | Eyob | Finland | Espoo | 108.0 | 1.73 | 36.1 | 1983 | 2021 | Obesity Range |
| 4 | Pawel | Poland | Warsaw | 102.0 | 1.95 | 26.8 | 1985 | 2021 | Overweight Range |
| 5 | Mahlet | Ethiopia | Addis Ababa | 58.0 | 1.68 | 20.5 | 1995 | 2021 | Healthy Range |
| 6 | Thomas | Ethiopia | Bahir Dar | 52.0 | 1.70 | 18.0 | 1999 | 2021 | Underweight Range |
| 7 | Lidiya | NaN | NaN | NaN | NaN | NaN | NaN | 2021 | None |
# Boolean indexing
df.iloc[lambda x : x.index % 2 == 0]
| Name | Country | City | Weight | Height | BMI | Birth Year | Current Year | BMI class | |
|---|---|---|---|---|---|---|---|---|---|
| 0 | Asabeneh | Finland | Helsinki | 74.0 | 1.73 | 24.7 | 1769 | 2021 | Healthy Range |
| 2 | John | Sweden | Stockholm | 68.0 | 1.69 | 23.8 | 1990 | 2021 | Healthy Range |
| 4 | Pawel | Poland | Warsaw | 102.0 | 1.95 | 26.8 | 1985 | 2021 | Overweight Range |
| 6 | Thomas | Ethiopia | Bahir Dar | 52.0 | 1.70 | 18.0 | 1999 | 2021 | Underweight Range |
# Boolean indexing
df.iloc[lambda x : x.index % 2 != 0]
| Name | Country | City | Weight | Height | BMI | Birth Year | Current Year | BMI class | |
|---|---|---|---|---|---|---|---|---|---|
| 1 | David | UK | London | 78.0 | 1.75 | 25.5 | 1985 | 2021 | Overweight Range |
| 3 | Eyob | Finland | Espoo | 108.0 | 1.73 | 36.1 | 1983 | 2021 | Obesity Range |
| 5 | Mahlet | Ethiopia | Addis Ababa | 58.0 | 1.68 | 20.5 | 1995 | 2021 | Healthy Range |
| 7 | Lidiya | NaN | NaN | NaN | NaN | NaN | NaN | 2021 | None |
# index and column ,[index, col] to get a value in a cell

df.iloc[0, 1]
'Finland'
df
| Name | Country | City | Weight | Height | BMI | Birth Year | Current Year | BMI class | |
|---|---|---|---|---|---|---|---|---|---|
| 0 | Asabeneh | Finland | Helsinki | 74.0 | 1.73 | 24.7 | 1769 | 2021 | Healthy Range |
| 1 | David | UK | London | 78.0 | 1.75 | 25.5 | 1985 | 2021 | Overweight Range |
| 2 | John | Sweden | Stockholm | 68.0 | 1.69 | 23.8 | 1990 | 2021 | Healthy Range |
| 3 | Eyob | Finland | Espoo | 108.0 | 1.73 | 36.1 | 1983 | 2021 | Obesity Range |
| 4 | Pawel | Poland | Warsaw | 102.0 | 1.95 | 26.8 | 1985 | 2021 | Overweight Range |
| 5 | Mahlet | Ethiopia | Addis Ababa | 58.0 | 1.68 | 20.5 | 1995 | 2021 | Healthy Range |
| 6 | Thomas | Ethiopia | Bahir Dar | 52.0 | 1.70 | 18.0 | 1999 | 2021 | Underweight Range |
| 7 | Lidiya | NaN | NaN | NaN | NaN | NaN | NaN | 2021 | None |
# slicing three rows
df.iloc[0:3]
| Name | Country | City | Weight | Height | BMI | Birth Year | Current Year | BMI class | |
|---|---|---|---|---|---|---|---|---|---|
| 0 | Asabeneh | Finland | Helsinki | 74.0 | 1.73 | 24.7 | 1769 | 2021 | Healthy Range |
| 1 | David | UK | London | 78.0 | 1.75 | 25.5 | 1985 | 2021 | Overweight Range |
| 2 | John | Sweden | Stockholm | 68.0 | 1.69 | 23.8 | 1990 | 2021 | Healthy Range |
## Slicing some part of a data frame
df.iloc[0:3,0:3]
| Name | Country | City | |
|---|---|---|---|
| 0 | Asabeneh | Finland | Helsinki |
| 1 | David | UK | London |
| 2 | John | Sweden | Stockholm |
## Slicing some part of a data frame
df.iloc[0:3,3:]
| Weight | Height | BMI | Birth Year | Current Year | BMI class | |
|---|---|---|---|---|---|---|
| 0 | 74.0 | 1.73 | 24.7 | 1769 | 2021 | Healthy Range |
| 1 | 78.0 | 1.75 | 25.5 | 1985 | 2021 | Overweight Range |
| 2 | 68.0 | 1.69 | 23.8 | 1990 | 2021 | Healthy Range |
We can use the concat() method to join different dataframes horizontally.
df
| Name | Country | City | Weight | Height | BMI | Birth Year | Current Year | BMI class | |
|---|---|---|---|---|---|---|---|---|---|
| 0 | Asabeneh | Finland | Helsinki | 74.0 | 1.73 | 24.7 | 1769 | 2021 | Healthy Range |
| 1 | David | UK | London | 78.0 | 1.75 | 25.5 | 1985 | 2021 | Overweight Range |
| 2 | John | Sweden | Stockholm | 68.0 | 1.69 | 23.8 | 1990 | 2021 | Healthy Range |
| 3 | Eyob | Finland | Espoo | 108.0 | 1.73 | 36.1 | 1983 | 2021 | Obesity Range |
| 4 | Pawel | Poland | Warsaw | 102.0 | 1.95 | 26.8 | 1985 | 2021 | Overweight Range |
| 5 | Mahlet | Ethiopia | Addis Ababa | 58.0 | 1.68 | 20.5 | 1995 | 2021 | Healthy Range |
| 6 | Thomas | Ethiopia | Bahir Dar | 52.0 | 1.70 | 18.0 | 1999 | 2021 | Underweight Range |
| 7 | Lidiya | NaN | NaN | NaN | NaN | NaN | NaN | 2021 | None |
joined_df = pd.concat([df, df])
joined_df
| Name | Country | City | Weight | Height | BMI | Birth Year | Current Year | BMI class | |
|---|---|---|---|---|---|---|---|---|---|
| 0 | Asabeneh | Finland | Helsinki | 74.0 | 1.73 | 24.7 | 1769 | 2021 | Healthy Range |
| 1 | David | UK | London | 78.0 | 1.75 | 25.5 | 1985 | 2021 | Overweight Range |
| 2 | John | Sweden | Stockholm | 68.0 | 1.69 | 23.8 | 1990 | 2021 | Healthy Range |
| 3 | Eyob | Finland | Espoo | 108.0 | 1.73 | 36.1 | 1983 | 2021 | Obesity Range |
| 4 | Pawel | Poland | Warsaw | 102.0 | 1.95 | 26.8 | 1985 | 2021 | Overweight Range |
| 5 | Mahlet | Ethiopia | Addis Ababa | 58.0 | 1.68 | 20.5 | 1995 | 2021 | Healthy Range |
| 6 | Thomas | Ethiopia | Bahir Dar | 52.0 | 1.70 | 18.0 | 1999 | 2021 | Underweight Range |
| 7 | Lidiya | NaN | NaN | NaN | NaN | NaN | NaN | 2021 | None |
Data cleaning takes most of the time in the data analysis work flow. The data cleaning is the first stage in the data analysis work flow.
df
| Name | Country | City | Weight | Height | BMI | Birth Year | Current Year | BMI class | |
|---|---|---|---|---|---|---|---|---|---|
| 0 | Asabeneh | Finland | Helsinki | 74.0 | 1.73 | 24.7 | 1769 | 2021 | Healthy Range |
| 1 | David | UK | London | 78.0 | 1.75 | 25.5 | 1985 | 2021 | Overweight Range |
| 2 | John | Sweden | Stockholm | 68.0 | 1.69 | 23.8 | 1990 | 2021 | Healthy Range |
| 3 | Eyob | Finland | Espoo | 108.0 | 1.73 | 36.1 | 1983 | 2021 | Obesity Range |
| 4 | Pawel | Poland | Warsaw | 102.0 | 1.95 | 26.8 | 1985 | 2021 | Overweight Range |
| 5 | Mahlet | Ethiopia | Addis Ababa | 58.0 | 1.68 | 20.5 | 1995 | 2021 | Healthy Range |
| 6 | Thomas | Ethiopia | Bahir Dar | 52.0 | 1.70 | 18.0 | 1999 | 2021 | Underweight Range |
| 7 | Lidiya | NaN | NaN | NaN | NaN | NaN | NaN | 2021 | None |
# the info provides information about the data
# Only the Name and Current Year columns are complete data values
# The last row has many NaN value, we can fill it with some value
df.info()
<class 'pandas.core.frame.DataFrame'>
RangeIndex: 8 entries, 0 to 7
Data columns (total 9 columns):
 #   Column        Non-Null Count  Dtype
---  ------        --------------  -----
 0   Name          8 non-null      object
 1   Country       7 non-null      object
 2   City          7 non-null      object
 3   Weight        7 non-null      float64
 4   Height        7 non-null      float64
 5   BMI           7 non-null      float64
 6   Birth Year    7 non-null      object
 7   Current Year  8 non-null      int64
 8   BMI class     7 non-null      object
dtypes: float64(3), int64(1), object(5)
memory usage: 704.0+ bytes
# to modify it from the originial we should use inplace=True argument
df.fillna('sample data')
| Name | Country | City | Weight | Height | BMI | Birth Year | Current Year | BMI class | |
|---|---|---|---|---|---|---|---|---|---|
| 0 | Asabeneh | Finland | Helsinki | 74 | 1.73 | 24.7 | 1769 | 2021 | Healthy Range |
| 1 | David | UK | London | 78 | 1.75 | 25.5 | 1985 | 2021 | Overweight Range |
| 2 | John | Sweden | Stockholm | 68 | 1.69 | 23.8 | 1990 | 2021 | Healthy Range |
| 3 | Eyob | Finland | Espoo | 108 | 1.73 | 36.1 | 1983 | 2021 | Obesity Range |
| 4 | Pawel | Poland | Warsaw | 102 | 1.95 | 26.8 | 1985 | 2021 | Overweight Range |
| 5 | Mahlet | Ethiopia | Addis Ababa | 58 | 1.68 | 20.5 | 1995 | 2021 | Healthy Range |
| 6 | Thomas | Ethiopia | Bahir Dar | 52 | 1.7 | 18 | 1999 | 2021 | Underweight Range |
| 7 | Lidiya | sample data | sample data | sample data | sample data | sample data | sample data | 2021 | sample data |
# We can also replace only a certain columns
df['Country'].fillna('Finland', inplace=True)
df
| Name | Country | City | Weight | Height | BMI | Birth Year | Current Year | BMI class | |
|---|---|---|---|---|---|---|---|---|---|
| 0 | Asabeneh | Finland | Helsinki | 74.0 | 1.73 | 24.7 | 1769 | 2021 | Healthy Range |
| 1 | David | UK | London | 78.0 | 1.75 | 25.5 | 1985 | 2021 | Overweight Range |
| 2 | John | Sweden | Stockholm | 68.0 | 1.69 | 23.8 | 1990 | 2021 | Healthy Range |
| 3 | Eyob | Finland | Espoo | 108.0 | 1.73 | 36.1 | 1983 | 2021 | Obesity Range |
| 4 | Pawel | Poland | Warsaw | 102.0 | 1.95 | 26.8 | 1985 | 2021 | Overweight Range |
| 5 | Mahlet | Ethiopia | Addis Ababa | 58.0 | 1.68 | 20.5 | 1995 | 2021 | Healthy Range |
| 6 | Thomas | Ethiopia | Bahir Dar | 52.0 | 1.70 | 18.0 | 1999 | 2021 | Underweight Range |
| 7 | Lidiya | Finland | NaN | NaN | NaN | NaN | NaN | 2021 | None |
# We can also remove the row containing the null
# We can use inplace=True, to make change to the original

df.dropna()
| Name | Country | City | Weight | Height | BMI | Birth Year | Current Year | BMI class | |
|---|---|---|---|---|---|---|---|---|---|
| 0 | Asabeneh | Finland | Helsinki | 74.0 | 1.73 | 24.7 | 1769 | 2021 | Healthy Range |
| 1 | David | UK | London | 78.0 | 1.75 | 25.5 | 1985 | 2021 | Overweight Range |
| 2 | John | Sweden | Stockholm | 68.0 | 1.69 | 23.8 | 1990 | 2021 | Healthy Range |
| 3 | Eyob | Finland | Espoo | 108.0 | 1.73 | 36.1 | 1983 | 2021 | Obesity Range |
| 4 | Pawel | Poland | Warsaw | 102.0 | 1.95 | 26.8 | 1985 | 2021 | Overweight Range |
| 5 | Mahlet | Ethiopia | Addis Ababa | 58.0 | 1.68 | 20.5 | 1995 | 2021 | Healthy Range |
| 6 | Thomas | Ethiopia | Bahir Dar | 52.0 | 1.70 | 18.0 | 1999 | 2021 | Underweight Range |
# We can use mean, median, mode methods to calculate descriptive statistics from data using pandas
mean = df.iloc[1:]['Birth Year'].astype(float).mean()
# Replacing outliers
# Birth year 1769 does sould plausible, lets replace or imput that vaue with avarage birth year
# To target 1769 data we can use loc or iloc method
df.loc[0, 'Birth Year']
'1769'
df.iloc[0, 6]
'1769'
df.iloc[0, 6] = round( mean)
df
| Name | Country | City | Weight | Height | BMI | Birth Year | Current Year | BMI class | |
|---|---|---|---|---|---|---|---|---|---|
| 0 | Asabeneh | Finland | Helsinki | 74.0 | 1.73 | 24.7 | 1990 | 2021 | Healthy Range |
| 1 | David | UK | London | 78.0 | 1.75 | 25.5 | 1985 | 2021 | Overweight Range |
| 2 | John | Sweden | Stockholm | 68.0 | 1.69 | 23.8 | 1990 | 2021 | Healthy Range |
| 3 | Eyob | Finland | Espoo | 108.0 | 1.73 | 36.1 | 1983 | 2021 | Obesity Range |
| 4 | Pawel | Poland | Warsaw | 102.0 | 1.95 | 26.8 | 1985 | 2021 | Overweight Range |
| 5 | Mahlet | Ethiopia | Addis Ababa | 58.0 | 1.68 | 20.5 | 1995 | 2021 | Healthy Range |
| 6 | Thomas | Ethiopia | Bahir Dar | 52.0 | 1.70 | 18.0 | 1999 | 2021 | Underweight Range |
| 7 | Lidiya | Finland | NaN | NaN | NaN | NaN | NaN | 2021 | None |
Checking if there is duplicates using the duplicated() method. If there is a duplicate, it returns True otherwise False. The data below has a duplicate.
joined_df
| Name | Country | City | Weight | Height | BMI | Birth Year | Current Year | BMI class | |
|---|---|---|---|---|---|---|---|---|---|
| 0 | Asabeneh | Finland | Helsinki | 74.0 | 1.73 | 24.7 | 1769 | 2021 | Healthy Range |
| 1 | David | UK | London | 78.0 | 1.75 | 25.5 | 1985 | 2021 | Overweight Range |
| 2 | John | Sweden | Stockholm | 68.0 | 1.69 | 23.8 | 1990 | 2021 | Healthy Range |
| 3 | Eyob | Finland | Espoo | 108.0 | 1.73 | 36.1 | 1983 | 2021 | Obesity Range |
| 4 | Pawel | Poland | Warsaw | 102.0 | 1.95 | 26.8 | 1985 | 2021 | Overweight Range |
| 5 | Mahlet | Ethiopia | Addis Ababa | 58.0 | 1.68 | 20.5 | 1995 | 2021 | Healthy Range |
| 6 | Thomas | Ethiopia | Bahir Dar | 52.0 | 1.70 | 18.0 | 1999 | 2021 | Underweight Range |
| 7 | Lidiya | NaN | NaN | NaN | NaN | NaN | NaN | 2021 | None |
| 0 | Asabeneh | Finland | Helsinki | 74.0 | 1.73 | 24.7 | 1769 | 2021 | Healthy Range |
| 1 | David | UK | London | 78.0 | 1.75 | 25.5 | 1985 | 2021 | Overweight Range |
| 2 | John | Sweden | Stockholm | 68.0 | 1.69 | 23.8 | 1990 | 2021 | Healthy Range |
| 3 | Eyob | Finland | Espoo | 108.0 | 1.73 | 36.1 | 1983 | 2021 | Obesity Range |
| 4 | Pawel | Poland | Warsaw | 102.0 | 1.95 | 26.8 | 1985 | 2021 | Overweight Range |
| 5 | Mahlet | Ethiopia | Addis Ababa | 58.0 | 1.68 | 20.5 | 1995 | 2021 | Healthy Range |
| 6 | Thomas | Ethiopia | Bahir Dar | 52.0 | 1.70 | 18.0 | 1999 | 2021 | Underweight Range |
| 7 | Lidiya | NaN | NaN | NaN | NaN | NaN | NaN | 2021 | None |
joined_df.duplicated()
0    False
1    False
2    False
3    False
4    False
5    False
6    False
7    False
0     True
1     True
2     True
3     True
4     True
5     True
6     True
7     True
dtype: bool
# removing dupliacates
joined_df.drop_duplicates(inplace=True)
joined_df
| Name | Country | City | Weight | Height | BMI | Birth Year | Current Year | BMI class | |
|---|---|---|---|---|---|---|---|---|---|
| 0 | Asabeneh | Finland | Helsinki | 74.0 | 1.73 | 24.7 | 1769 | 2021 | Healthy Range |
| 1 | David | UK | London | 78.0 | 1.75 | 25.5 | 1985 | 2021 | Overweight Range |
| 2 | John | Sweden | Stockholm | 68.0 | 1.69 | 23.8 | 1990 | 2021 | Healthy Range |
| 3 | Eyob | Finland | Espoo | 108.0 | 1.73 | 36.1 | 1983 | 2021 | Obesity Range |
| 4 | Pawel | Poland | Warsaw | 102.0 | 1.95 | 26.8 | 1985 | 2021 | Overweight Range |
| 5 | Mahlet | Ethiopia | Addis Ababa | 58.0 | 1.68 | 20.5 | 1995 | 2021 | Healthy Range |
| 6 | Thomas | Ethiopia | Bahir Dar | 52.0 | 1.70 | 18.0 | 1999 | 2021 | Underweight Range |
| 7 | Lidiya | NaN | NaN | NaN | NaN | NaN | NaN | 2021 | None |
## Lets drop the null and do descriptive statistics
joined_df.dropna(inplace=True)
joined_df
| Name | Country | City | Weight | Height | BMI | Birth Year | Current Year | BMI class | |
|---|---|---|---|---|---|---|---|---|---|
| 0 | Asabeneh | Finland | Helsinki | 74.0 | 1.73 | 24.7 | 1769 | 2021 | Healthy Range |
| 1 | David | UK | London | 78.0 | 1.75 | 25.5 | 1985 | 2021 | Overweight Range |
| 2 | John | Sweden | Stockholm | 68.0 | 1.69 | 23.8 | 1990 | 2021 | Healthy Range |
| 3 | Eyob | Finland | Espoo | 108.0 | 1.73 | 36.1 | 1983 | 2021 | Obesity Range |
| 4 | Pawel | Poland | Warsaw | 102.0 | 1.95 | 26.8 | 1985 | 2021 | Overweight Range |
| 5 | Mahlet | Ethiopia | Addis Ababa | 58.0 | 1.68 | 20.5 | 1995 | 2021 | Healthy Range |
| 6 | Thomas | Ethiopia | Bahir Dar | 52.0 | 1.70 | 18.0 | 1999 | 2021 | Underweight Range |
joined_df.describe()
| Weight | Height | BMI | Current Year | |
|---|---|---|---|---|
| count | 7.000000 | 7.000000 | 7.000000 | 7.0 |
| mean | 77.142857 | 1.747143 | 25.057143 | 2021.0 |
| std | 21.066787 | 0.092864 | 5.736682 | 0.0 |
| min | 52.000000 | 1.680000 | 18.000000 | 2021.0 |
| 25% | 63.000000 | 1.695000 | 22.150000 | 2021.0 |
| 50% | 74.000000 | 1.730000 | 24.700000 | 2021.0 |
| 75% | 90.000000 | 1.740000 | 26.150000 | 2021.0 |
| max | 108.000000 | 1.950000 | 36.100000 | 2021.0 |
# We can also use mean, median mode separately

joined_df.mean()
Weight          7.714286e+01
Height          1.747143e+00
BMI             2.505714e+01
Birth Year      2.527426e+26
Current Year    2.021000e+03
dtype: float64
joined_df.median()
Weight            74.00
Height             1.73
BMI               24.70
Birth Year      1985.00
Current Year    2021.00
dtype: float64
# mode of the Country column
joined_df['Country'].mode()
0    Ethiopia
1     Finland
dtype: object
# Standard Deviation of the numeric columns
joined_df.std()
Weight          21.066787
Height           0.092864
BMI              5.736682
Current Year     0.000000
dtype: float64
# Varience of the numeric columns
joined_df.var()
Weight          443.809524
Height            0.008624
BMI              32.909524
Current Year      0.000000
dtype: float64
# Correlation shows the relationship between two variables. The value is between -1 and 1.
# 0 No correlation at all
# 1 mean a perfect relation
# BMI has high correlation with Weight, however Height has relatively low correlation with BMI
joined_df.corr()
| Weight | Height | BMI | Current Year | |
|---|---|---|---|---|
| Weight | 1.000000 | 0.644298 | 0.912597 | NaN |
| Height | 0.644298 | 1.000000 | 0.275980 | NaN |
| BMI | 0.912597 | 0.275980 | 1.000000 | NaN |
| Current Year | NaN | NaN | NaN | NaN |
joined_df['Country'].value_counts()
Ethiopia    2
Finland     2
UK          1
Sweden      1
Poland      1
Name: Country, dtype: int64
joined_df['City'].value_counts()
Addis Ababa    1
Helsinki       1
Espoo          1
Bahir Dar      1
Stockholm      1
Warsaw         1
London         1
Name: City, dtype: int64
df.groupby('Country').mean()
| Weight | Height | BMI | Current Year | |
|---|---|---|---|---|
| Country | ||||
| Ethiopia | 55.0 | 1.69 | 19.25 | 2021 |
| Finland | 91.0 | 1.73 | 30.40 | 2021 |
| Poland | 102.0 | 1.95 | 26.80 | 2021 |
| Sweden | 68.0 | 1.69 | 23.80 | 2021 |
| UK | 78.0 | 1.75 | 25.50 | 2021 |
df.groupby('Country', sort=True).mean()
| Weight | Height | BMI | Current Year | |
|---|---|---|---|---|
| Country | ||||
| Ethiopia | 55.0 | 1.69 | 19.25 | 2021 |
| Finland | 91.0 | 1.73 | 30.40 | 2021 |
| Poland | 102.0 | 1.95 | 26.80 | 2021 |
| Sweden | 68.0 | 1.69 | 23.80 | 2021 |
| UK | 78.0 | 1.75 | 25.50 | 2021 |
df.sort_values('Country')
| Name | Country | City | Weight | Height | BMI | Birth Year | Current Year | BMI class | |
|---|---|---|---|---|---|---|---|---|---|
| 5 | Mahlet | Ethiopia | Addis Ababa | 58.0 | 1.68 | 20.5 | 1995 | 2021 | Healthy Range |
| 6 | Thomas | Ethiopia | Bahir Dar | 52.0 | 1.70 | 18.0 | 1999 | 2021 | Underweight Range |
| 0 | Asabeneh | Finland | Helsinki | 74.0 | 1.73 | 24.7 | 1990 | 2021 | Healthy Range |
| 3 | Eyob | Finland | Espoo | 108.0 | 1.73 | 36.1 | 1983 | 2021 | Obesity Range |
| 7 | Lidiya | Finland | NaN | NaN | NaN | NaN | NaN | 2021 | None |
| 4 | Pawel | Poland | Warsaw | 102.0 | 1.95 | 26.8 | 1985 | 2021 | Overweight Range |
| 2 | John | Sweden | Stockholm | 68.0 | 1.69 | 23.8 | 1990 | 2021 | Healthy Range |
| 1 | David | UK | London | 78.0 | 1.75 | 25.5 | 1985 | 2021 | Overweight Range |
df.sort_values('Country' , ascending=False)
| Name | Country | City | Weight | Height | BMI | Birth Year | Current Year | BMI class | |
|---|---|---|---|---|---|---|---|---|---|
| 1 | David | UK | London | 78.0 | 1.75 | 25.5 | 1985 | 2021 | Overweight Range |
| 2 | John | Sweden | Stockholm | 68.0 | 1.69 | 23.8 | 1990 | 2021 | Healthy Range |
| 4 | Pawel | Poland | Warsaw | 102.0 | 1.95 | 26.8 | 1985 | 2021 | Overweight Range |
| 0 | Asabeneh | Finland | Helsinki | 74.0 | 1.73 | 24.7 | 1990 | 2021 | Healthy Range |
| 3 | Eyob | Finland | Espoo | 108.0 | 1.73 | 36.1 | 1983 | 2021 | Obesity Range |
| 7 | Lidiya | Finland | NaN | NaN | NaN | NaN | NaN | 2021 | None |
| 5 | Mahlet | Ethiopia | Addis Ababa | 58.0 | 1.68 | 20.5 | 1995 | 2021 | Healthy Range |
| 6 | Thomas | Ethiopia | Bahir Dar | 52.0 | 1.70 | 18.0 | 1999 | 2021 | Underweight Range |
df.sort_values('City' , ascending=False, na_position='first')
| Name | Country | City | Weight | Height | BMI | Birth Year | Current Year | BMI class | |
|---|---|---|---|---|---|---|---|---|---|
| 7 | Lidiya | Finland | NaN | NaN | NaN | NaN | NaN | 2021 | None |
| 4 | Pawel | Poland | Warsaw | 102.0 | 1.95 | 26.8 | 1985 | 2021 | Overweight Range |
| 2 | John | Sweden | Stockholm | 68.0 | 1.69 | 23.8 | 1990 | 2021 | Healthy Range |
| 1 | David | UK | London | 78.0 | 1.75 | 25.5 | 1985 | 2021 | Overweight Range |
| 0 | Asabeneh | Finland | Helsinki | 74.0 | 1.73 | 24.7 | 1990 | 2021 | Healthy Range |
| 3 | Eyob | Finland | Espoo | 108.0 | 1.73 | 36.1 | 1983 | 2021 | Obesity Range |
| 6 | Thomas | Ethiopia | Bahir Dar | 52.0 | 1.70 | 18.0 | 1999 | 2021 | Underweight Range |
| 5 | Mahlet | Ethiopia | Addis Ababa | 58.0 | 1.68 | 20.5 | 1995 | 2021 | Healthy Range |
df.sort_values('BMI class', key=lambda col: col.str.lower())
| Name | Country | City | Weight | Height | BMI | Birth Year | Current Year | BMI class | |
|---|---|---|---|---|---|---|---|---|---|
| 0 | Asabeneh | Finland | Helsinki | 74.0 | 1.73 | 24.7 | 1990 | 2021 | Healthy Range |
| 2 | John | Sweden | Stockholm | 68.0 | 1.69 | 23.8 | 1990 | 2021 | Healthy Range |
| 5 | Mahlet | Ethiopia | Addis Ababa | 58.0 | 1.68 | 20.5 | 1995 | 2021 | Healthy Range |
| 3 | Eyob | Finland | Espoo | 108.0 | 1.73 | 36.1 | 1983 | 2021 | Obesity Range |
| 1 | David | UK | London | 78.0 | 1.75 | 25.5 | 1985 | 2021 | Overweight Range |
| 4 | Pawel | Poland | Warsaw | 102.0 | 1.95 | 26.8 | 1985 | 2021 | Overweight Range |
| 6 | Thomas | Ethiopia | Bahir Dar | 52.0 | 1.70 | 18.0 | 1999 | 2021 | Underweight Range |
| 7 | Lidiya | Finland | NaN | NaN | NaN | NaN | NaN | 2021 | None |
import matplotlib.pyplot as plt
joined_df.plot()
plt.show()

joined_df[['Weight','Height','BMI']]
| Weight | Height | BMI | |
|---|---|---|---|
| 0 | 74.0 | 1.73 | 24.7 |
| 1 | 78.0 | 1.75 | 25.5 |
| 2 | 68.0 | 1.69 | 23.8 |
| 3 | 108.0 | 1.73 | 36.1 |
| 4 | 102.0 | 1.95 | 26.8 |
| 5 | 58.0 | 1.68 | 20.5 |
| 6 | 52.0 | 1.70 | 18.0 |
joined_df[['Weight','Height','BMI']].plot()
plt.show()

joined_df[['Height','BMI']].plot(kind='scatter', x='Height', y = 'BMI', title = 'Height vs BMI')
plt.show()

joined_df[['Weight','BMI']].plot(kind='scatter', x='Weight', y = 'BMI', title = 'Weight vs BMI')
plt.show()

joined_df[['Weight']].plot(kind='bar')
plt.show()

joined_df[['Weight']].plot(kind='hist')
plt.show()

# Let's read a datas set and modify the height and weight value
df = pd.read_csv('./datasets/weight-height.csv')
df.head()
| Gender | Height | Weight | |
|---|---|---|---|
| 0 | Male | 73.847017 | 241.893563 |
| 1 | Male | 68.781904 | 162.310473 |
| 2 | Male | 74.110105 | 212.740856 |
| 3 | Male | 71.730978 | 220.042470 |
| 4 | Male | 69.881796 | 206.349801 |
df.tail()
| Gender | Height | Weight | |
|---|---|---|---|
| 9995 | Female | 66.172652 | 136.777454 |
| 9996 | Female | 67.067155 | 170.867906 |
| 9997 | Female | 63.867992 | 128.475319 |
| 9998 | Female | 69.034243 | 163.852461 |
| 9999 | Female | 61.944246 | 113.649103 |
df.info()
<class 'pandas.core.frame.DataFrame'>
RangeIndex: 10000 entries, 0 to 9999
Data columns (total 3 columns):
 #   Column  Non-Null Count  Dtype
---  ------  --------------  -----
 0   Gender  10000 non-null  object
 1   Height  10000 non-null  float64
 2   Weight  10000 non-null  float64
dtypes: float64(2), object(1)
memory usage: 234.5+ KB
df.shape
(10000, 3)
df.columns
Index(['Gender', 'Height', 'Weight'], dtype='object')
# changing inch to centimenter
# pounds to killogram
df['Height in Cm'] = df['Height'].apply(lambda x : x * 2.54 )
df['Weight in Kg'] = df['Weight'].apply(lambda x : x * 0.453592 )
df['BMI'] = df['Weight in Kg'] / (df['Height in Cm'] * 0.01) ** 2
df.head()
| Gender | Height | Weight | Height in Cm | Weight in Kg | BMI | |
|---|---|---|---|---|---|---|
| 0 | Male | 73.847017 | 241.893563 | 187.571423 | 109.720985 | 31.185761 |
| 1 | Male | 68.781904 | 162.310473 | 174.706036 | 73.622732 | 24.121044 |
| 2 | Male | 74.110105 | 212.740856 | 188.239668 | 96.497550 | 27.232906 |
| 3 | Male | 71.730978 | 220.042470 | 182.196685 | 99.809504 | 30.067059 |
| 4 | Male | 69.881796 | 206.349801 | 177.499761 | 93.598619 | 29.708033 |
df.describe()
| Height | Weight | Height in Cm | Weight in Kg | BMI | |
|---|---|---|---|---|---|
| count | 10000.000000 | 10000.000000 | 10000.000000 | 10000.000000 | 10000.000000 |
| mean | 66.367560 | 161.440357 | 168.573602 | 73.228054 | 25.475457 |
| std | 3.847528 | 32.108439 | 9.772721 | 14.564131 | 2.693810 |
| min | 54.263133 | 64.700127 | 137.828359 | 29.347460 | 15.448750 |
| 25% | 63.505620 | 135.818051 | 161.304276 | 61.605982 | 23.464807 |
| 50% | 66.318070 | 161.212928 | 168.447898 | 73.124894 | 25.733316 |
| 75% | 69.174262 | 187.169525 | 175.702625 | 84.898599 | 27.558535 |
| max | 78.998742 | 269.989699 | 200.656806 | 122.465167 | 33.028103 |
df.corr()
| Height | Weight | Height in Cm | Weight in Kg | BMI | |
|---|---|---|---|---|---|
| Height | 1.000000 | 0.924756 | 1.000000 | 0.924756 | 0.669199 |
| Weight | 0.924756 | 1.000000 | 0.924756 | 1.000000 | 0.896438 |
| Height in Cm | 1.000000 | 0.924756 | 1.000000 | 0.924756 | 0.669199 |
| Weight in Kg | 0.924756 | 1.000000 | 0.924756 | 1.000000 | 0.896438 |
| BMI | 0.669199 | 0.896438 | 0.669199 | 0.896438 | 1.000000 |
x = df['Height in Cm']
y = df['Weight in Kg']


m, b = np.polyfit(x, y, 1)

df[['Height in Cm', 'Weight in Kg']].plot(kind='scatter', x = 'Height in Cm', y='Weight in Kg', title='Height Versus Weight')
plt.plot(x, m*x + b, c='r', linewidth=5)
plt.show()
